Getting Started: Graphical User Interface#
If you prefer not to work from the command line, CasanovoGUI provides a cross-platform desktop application for Casanovo. It wraps Casanovo’s command-line tasks — de novo sequencing, database search, evaluation, and training — each as its own tab, and adds tools for exploring the results. Configure your inputs in a form, click Run Casanovo, and watch the output stream live in a console.
Installation#
CasanovoGUI’s native installers require no manual setup — you do not need to install Java, Python, or pip.
The cross-platform .jar is the exception: it needs a Java 23+ runtime already installed.
Download the installer for your platform from the CasanovoGUI Releases page:
Operating system
Download
How to run
Windows
CasanovoGUI-<version>-windows-x64.zipUnzip and run
CasanovoGUI.exemacOS (Apple Silicon)
CasanovoGUI-<version>-macos-arm64.dmgOpen and drag to Applications
Linux
CasanovoGUI-<version>-linux-x86_64.debor...-linux-x86_64.tar.gzInstall the
.deb, or extract the.tar.gz(no root) and runAny OS (Java 23+)
CasanovoGUI-<version>.jarRun with a Java 23+ runtime (also the option for Intel Macs)
The native installers bundle their own Java runtime, so no separate Java installation is needed.
Launch CasanovoGUI. The first time you start an analysis, if Casanovo is not already installed, the GUI offers to install it for you — it downloads a private Python and Casanovo automatically into
~/.casanovo-gui. Alternatively, if you already manage Casanovo in a Conda environment, enable “Run inside a Conda environment” in Settings to use that environment instead.
Running Casanovo#
De novo peptide sequencing#
The De novo tab runs casanovo sequence to predict peptide sequences directly from your spectra.
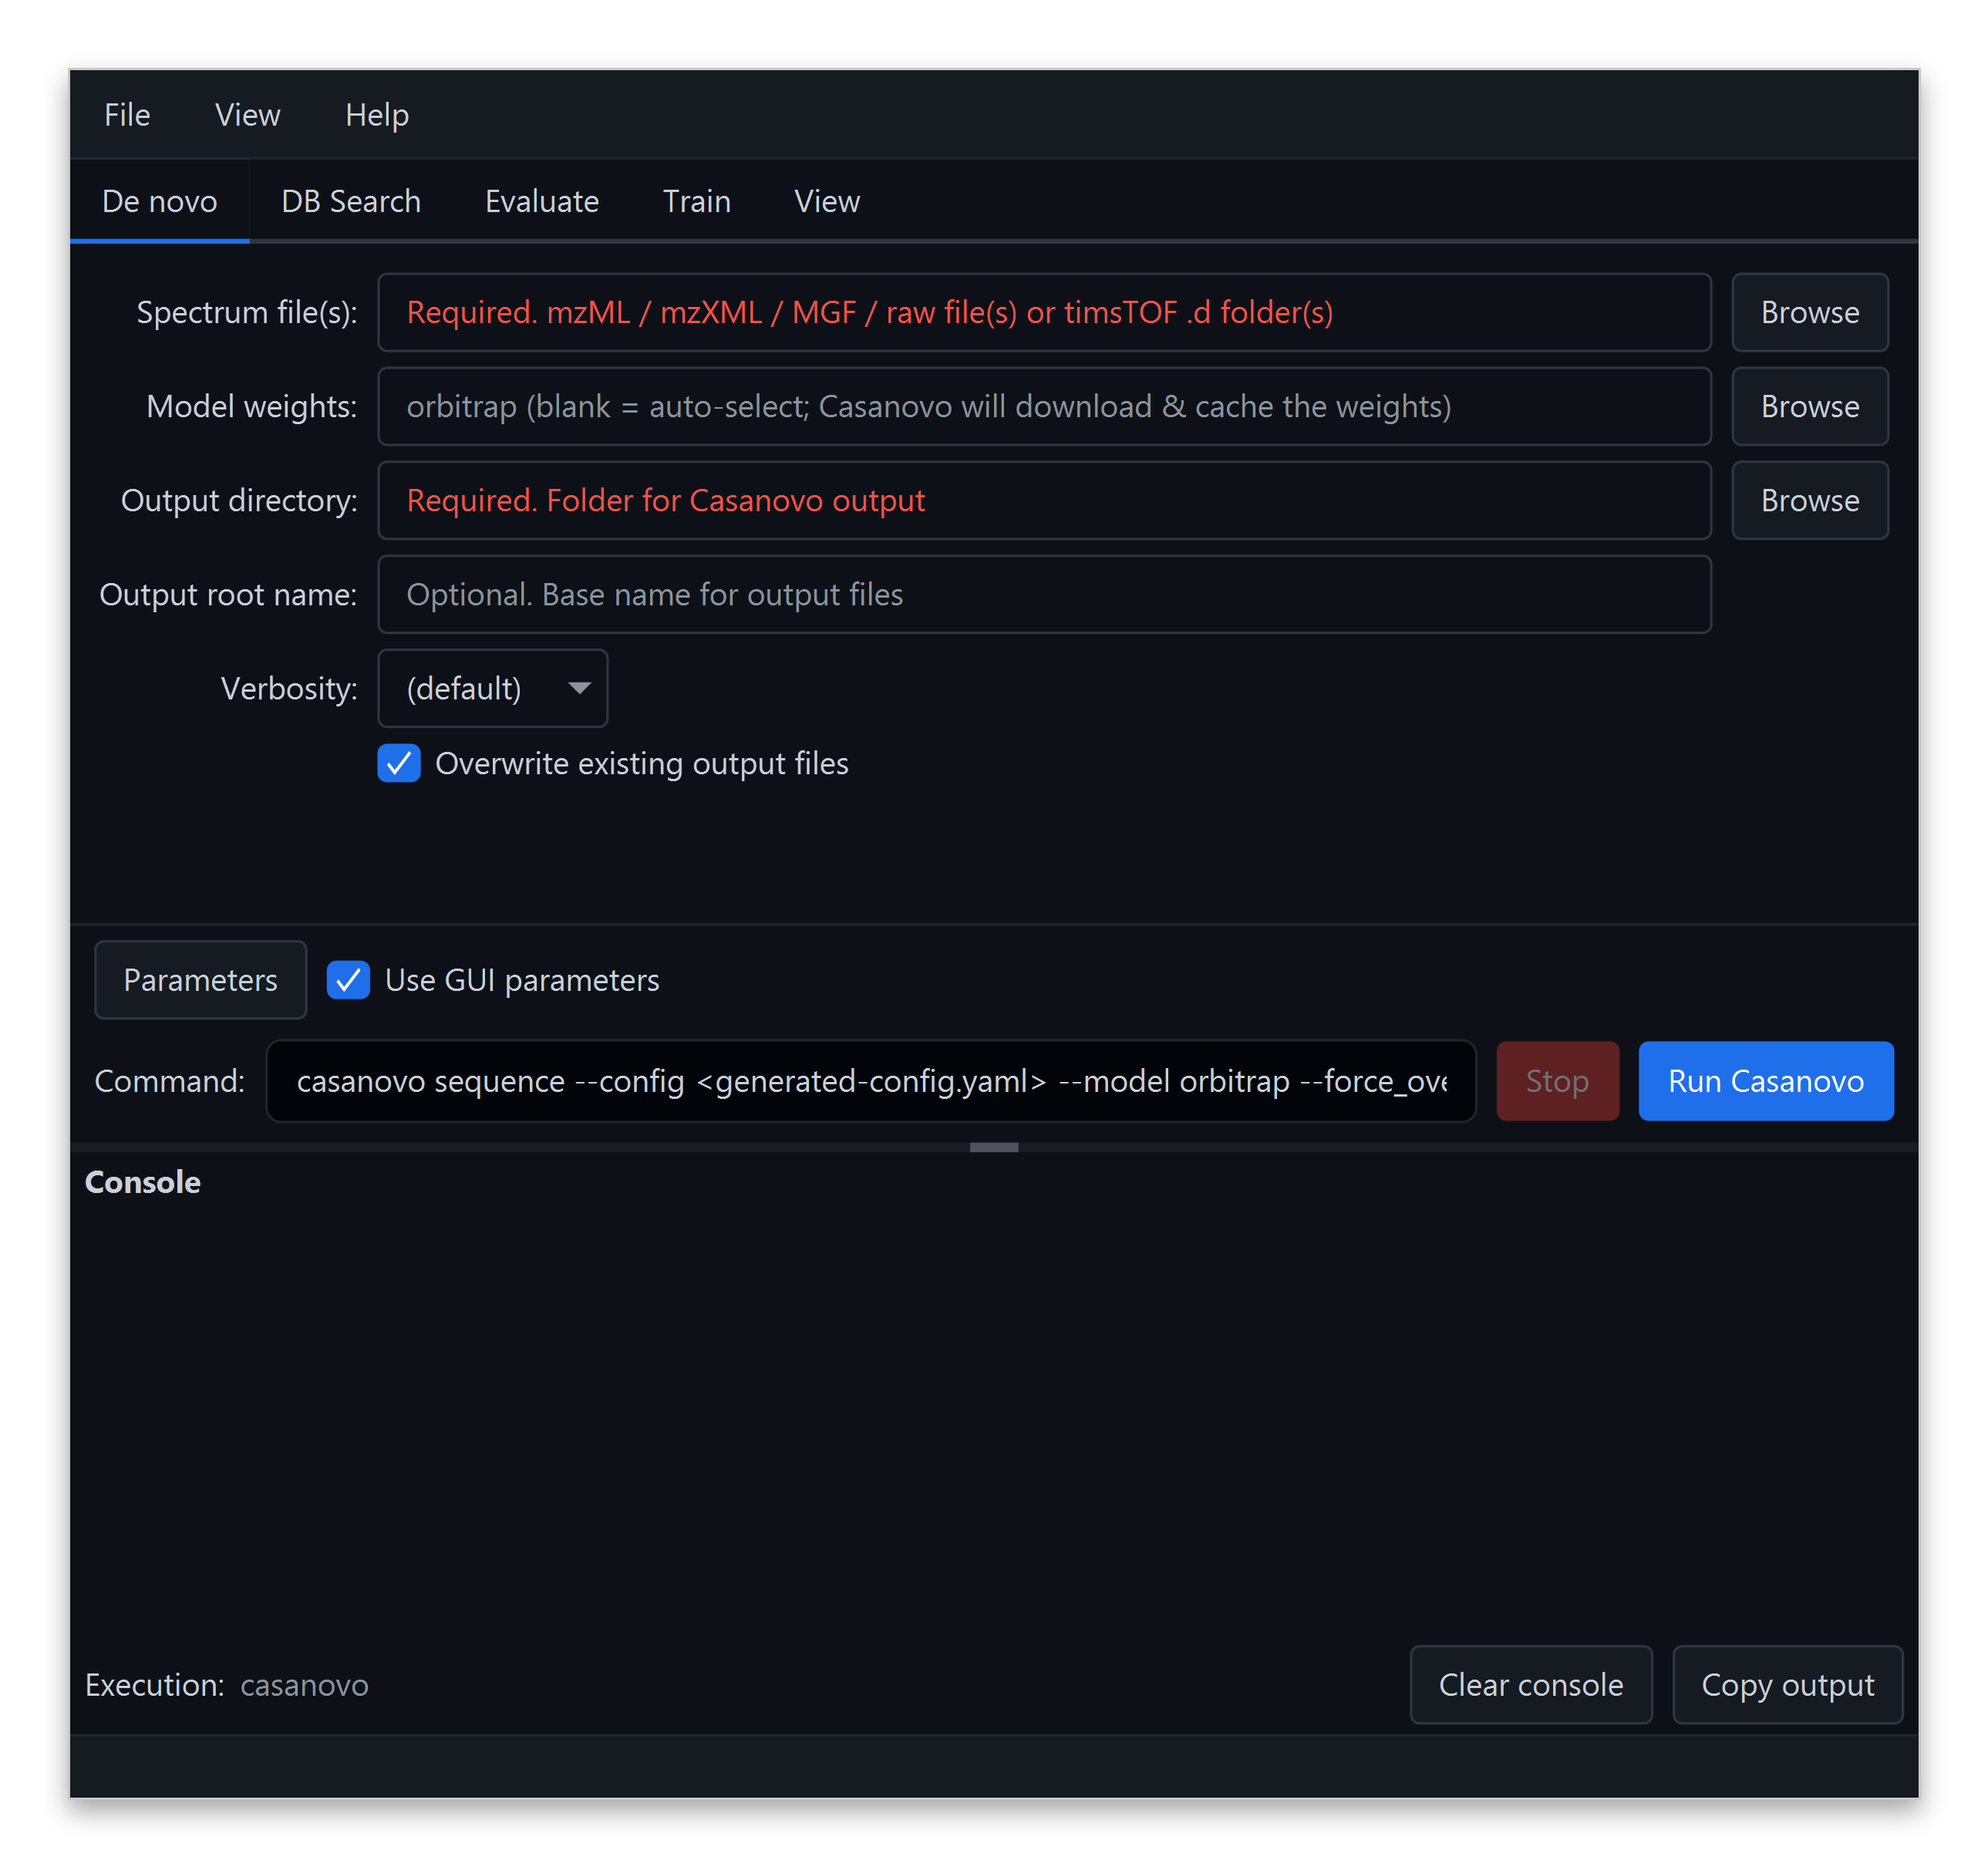
Its main settings are:
Spectrum file(s) (required) — one or more mzML, mzXML, or MGF files to sequence. You can select several at once.
Model weights (
--model) (optional) — a.ckptmodel file. Leave it blank to use Casanovo’s cached default weights, which the GUI detects and displays.Config file (
--config) (optional) — a YAML file that overrides parameters. Leave it blank to use the values from the Parameters dialog instead.Output directory (required) and output root name — where the result
.mztaband log are written, and the base name used for them. You must choose an output directory before running. If you leave the output root blank, Casanovo names the filescasanovo_<timestamp>.Verbosity and Overwrite existing output files — the logging level and whether to overwrite a previous run in the same folder.
Click Parameters to fine-tune any Casanovo setting (precursor m/z tolerance, peptide length, number of beams, batch size, accelerator, and more) without editing the Casanovo configuration file by hand.
A live command preview shows the exact casanovo ... command that will run.
Click Run Casanovo to start; the console streams the log as it runs, and the .mztab result is written to your output directory.
Other tasks#
The remaining tabs expose the corresponding Casanovo commands with the same form-based interface:
Database Search (
casanovo db-search) — score spectra against a protein FASTA database.Evaluate (
casanovo sequence --evaluate) — measure de novo performance against annotated spectra.Train (
casanovo train) — train or fine-tune a model from annotated MGF files.
For details on what each task does and its parameters, see Getting Started: Command Line Interface.
Exploring the results#
The View tab inspects a Casanovo .mzTab result without leaving the application:
Peptide-to-protein mapping — point it at a reference FASTA and it maps every de novo peptide back to your proteome, producing overview charts (PSM/peptide counts vs. peptide score, mapped peptides vs. score cutoff, and the top proteins), sortable and filterable protein, mapped, and unmapped tables, and per-protein coverage maps. Leave the FASTA blank to skip mapping and simply load every peptide.
Per-residue confidence — double-click any peptide to open a residue-by-residue confidence track colored by Casanovo’s per-amino-acid scores, alongside the PSMs supporting that peptide.
Spectrum visualization with PDV — with PDV open for a result, clicking a peptide selects that peptide’s best PSM and renders its annotated spectrum automatically. See Visualizing Casanovo Results With PDV.
Learn more#
Visit the CasanovoGUI GitHub repository for more details and the latest releases.